svg-chart
SVG Charts
![]()
![]()
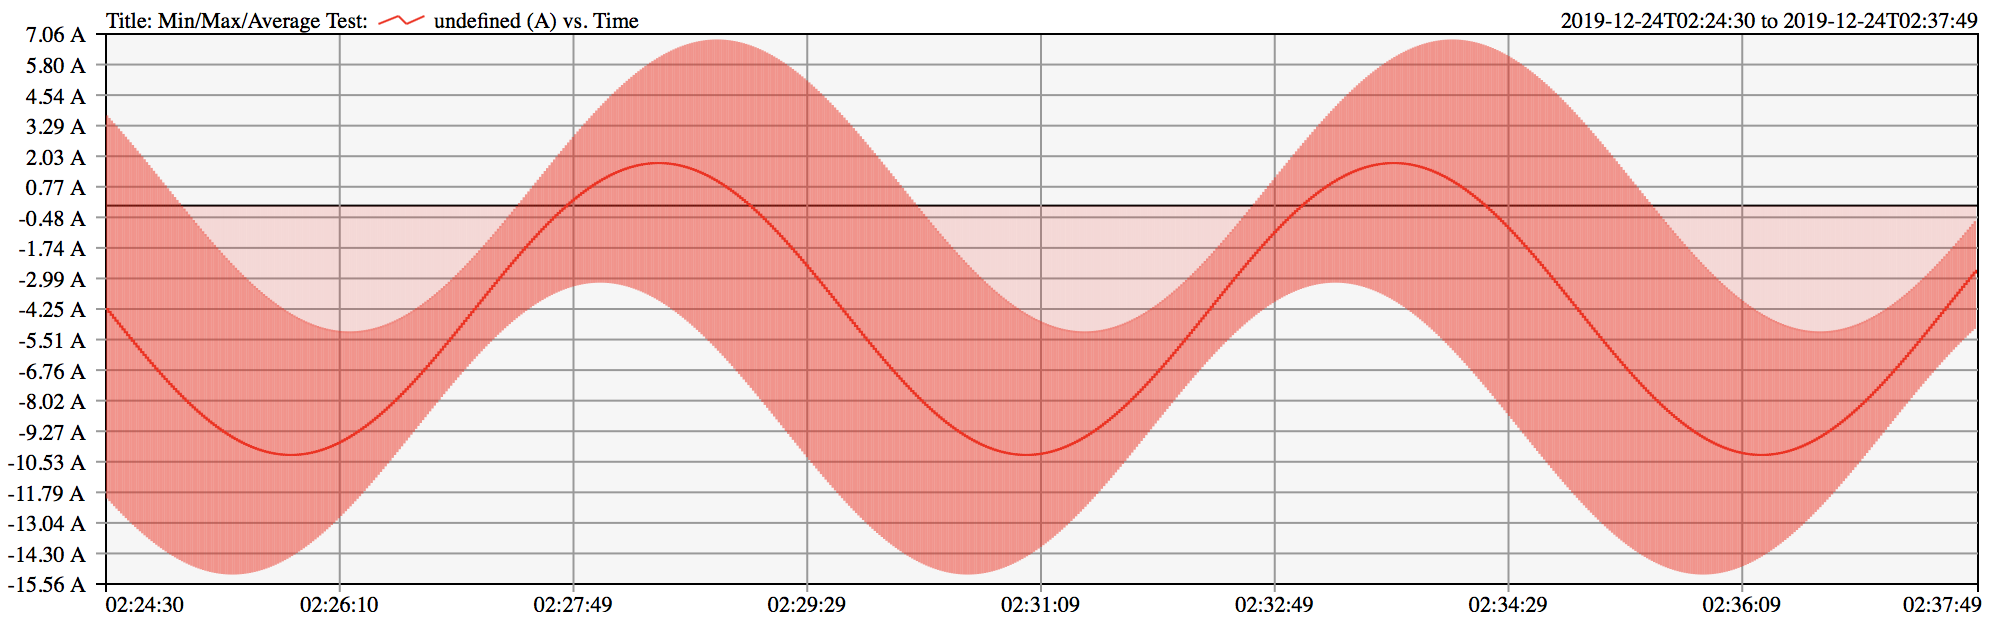
Simple charts using SVG
Core functionality includes:
- Multiple series
- Min/Max/Average series
- Gradient series
- Regions of indeterminacy
- Variable sample durations
Example:
See the tests for more examples: https://dslik.github.io/svg-chart/mmatests.html
An example of how to generate charts from Prometheus is also provided.
Note: This code has only been tested with Safari and Firefox. Bugs may exist when used in other browsers.
Gradients contained in the “rgb” directory are copyright Peter Kovesi, licensed under CC-BY-4.0.
Good Colour Maps: How to Design Them. arXiv:1509.03700 [cs.GR] 2015